The Basics of Housing Cost Burden
The Basics of Housing Cost Burden
Issue 1 in a series on housing cost burden

The term “housing affordability crisis” has a broad scope. It can easily refer to several different issues, from the destitute poverty of so many households who simply cannot afford the cost of housing, to the inability of the existing housing stock to house the number of people who need it in the places where they want to live, to effects of the profit motive (be it for property owners raising rents or for wealthy homeowners who oppose new subsidized housing) on the provision of shelter—the lowest rung on any hierarchy of needs.
There are many production-side issues (for example, it would take the Low-Income Housing Tax Credit program at least 50 years to build the number of subsidized homes to meet today’s need), but today I want to look at the simplest measures of housing affordability at the household level: housing cost burden. I have a couple of follow-up posts on this topic planned, so consider this the first in a short series on the issue.
What is cost burden, exactly?
Housing cost burden is a relatively simple metric. We’re looking at the ratio of a household’s gross monthly housing costs to the household’s gross monthly income. For example, if a household pays $1,000 in rent and receives $4,000 in income per month, its housing cost to income ratio is $1,000 / $4,000, or 0.25: that is, the household pays 25% of their income toward housing costs.
Housing cost burden, as defined by HUD, takes these quantitative ratios and assigns qualitative values to them. In HUD’s view, if a household’s housing cost to income ratio (HCIR) is greater than 0.3 (that is, if the household pays more than 30% of their income toward housing) then that household is housing cost burdened. If their HCIR is greater than 0.5 (i.e., 50%) then the household is severely housing cost burdened.
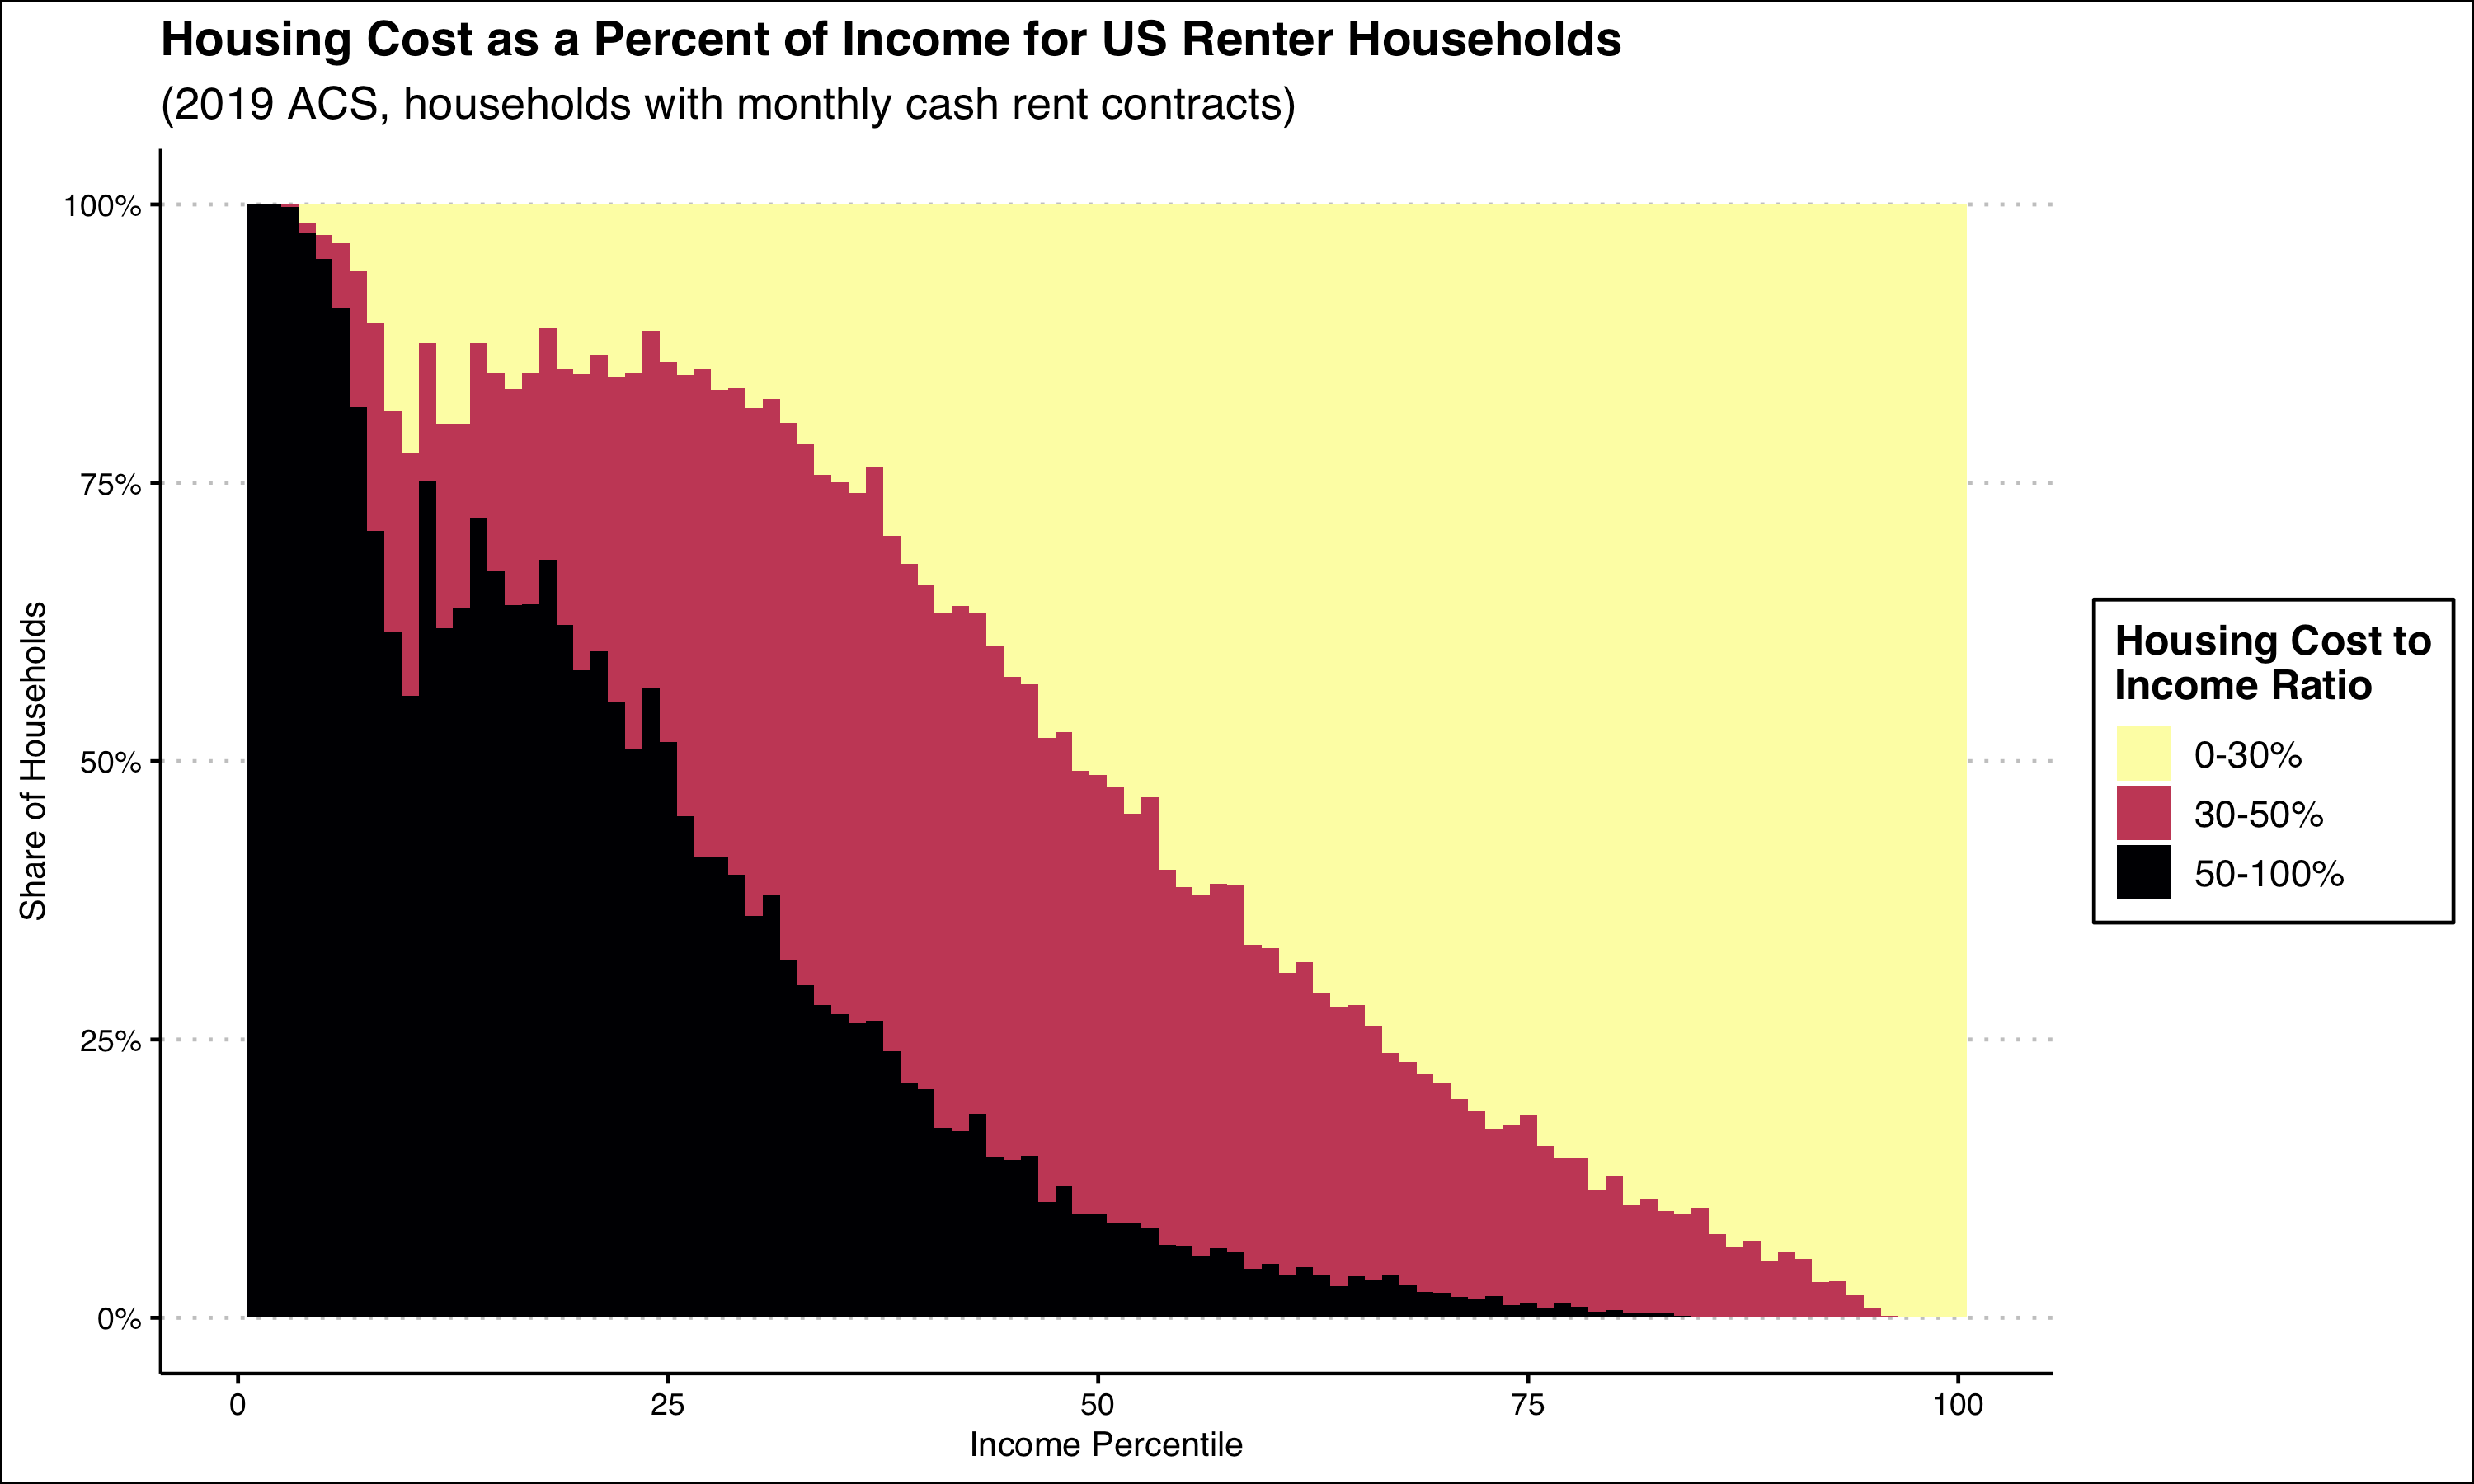
While these thresholds are essentially arbitrary, they can be somewhat useful for understanding poverty and housing outcomes. Below is a chart of U.S. renter households with monthly cash rent contracts showing the distribution of cost burden across household income percentiles. The data are provided by the Census Bureau’s American Community Survey Microdata. The dip and jump around the 10th-15th percentile is most likely due to means tested cutoffs for various public assistance dollars, though parsing exactly which programs and for whom is not possible with the ACS.
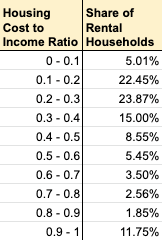
Astute readers might notice that these buckets defined by HUD (0-30%, 30-50%, and 50-100%) are not equal measures, which could skew how we interpret the figures. So to be more clear, we will break these HCIRs out into 10 equal buckets to glean a little more about the distribution.
Immediately we can see something that was hidden to us in the cost burden plot: The largest chunk of the severely cost burdened group is households who report paying more than 90% of their income to rent: a whopping 12% of US renter households—an incredible and disturbing figure.1
A note on zero income edge cases
There are some interesting edge cases in this data that are worth mentioning. Technically, I currently fall into the darkest purple category, paying between more than 90% of my income to rent. I am an unemployed graduate student with some savings, but my income is zero (other than the handful of my readers who give me $5/month). That means as long as my rent is greater than zero (I live in Brooklyn—my rent is greater than zero) my HCIR will technically be infinite, which is coded as 100% for simplicity’s sake.
The point being, anyone who reports zero income (e.g., no wages and no [cash] public assistance such as SSI or TANF) will have an HCIR of 100%. This accounts for about 18% of households in the 90-100% bucket. Even if you were to code these cases differently, households paying 90% or more of their income to rent would still be the largest bucket in severe burden group.
We can also take a look at how the distribution of cost burden plays out for households with other characteristics. If the provision of housing under American capitalism produced a semblance of just or egalitarian outcomes, we would expect to see some sense of even distribution between different household types. Instead, we see this:

In comparing single mother households to all other households there is a clear disparity. Even if one wanted to argue that most or all of this disparity can be attributed to income levels for single mother households skewing to the low end where cost burden is also concentrated, what we still have here is yet another of the significant impacts that low incomes households face.
But a retort of this form does not even appear to be correct. Some simple analysis indicates that single mother households experience deeper levels of cost burden, even controlled for income. Perhaps I will write more in detail about this in a follow-up post.
Ok, so how do you end cost burden?
When you get a sense of what these numbers mean for renters in this country (e.g., about half of US renter households are cost burdened per HUD’s definition) you may start to wonder what can be done about it. Since there are only two numbers at play (rent and income) the solutions really are either:
make rents go down, or
make incomes go up.
To be sure, the private ownership of land plays a significant role in the issue of rents by embedding the profit motive into the provision of shelter. Increases in housing stock, in particular social housing which can redirect surplus into permanent subsidy, impose downward pressure on rents, but again, we are setting aside these production questions for the moment and just looking at a current snapshot of household economics. So we will take a look at how cost burden would look if we make a couple of across-the-board changes:
universally reduce rents by 25%, or
universally increase household incomes by $500 per month.
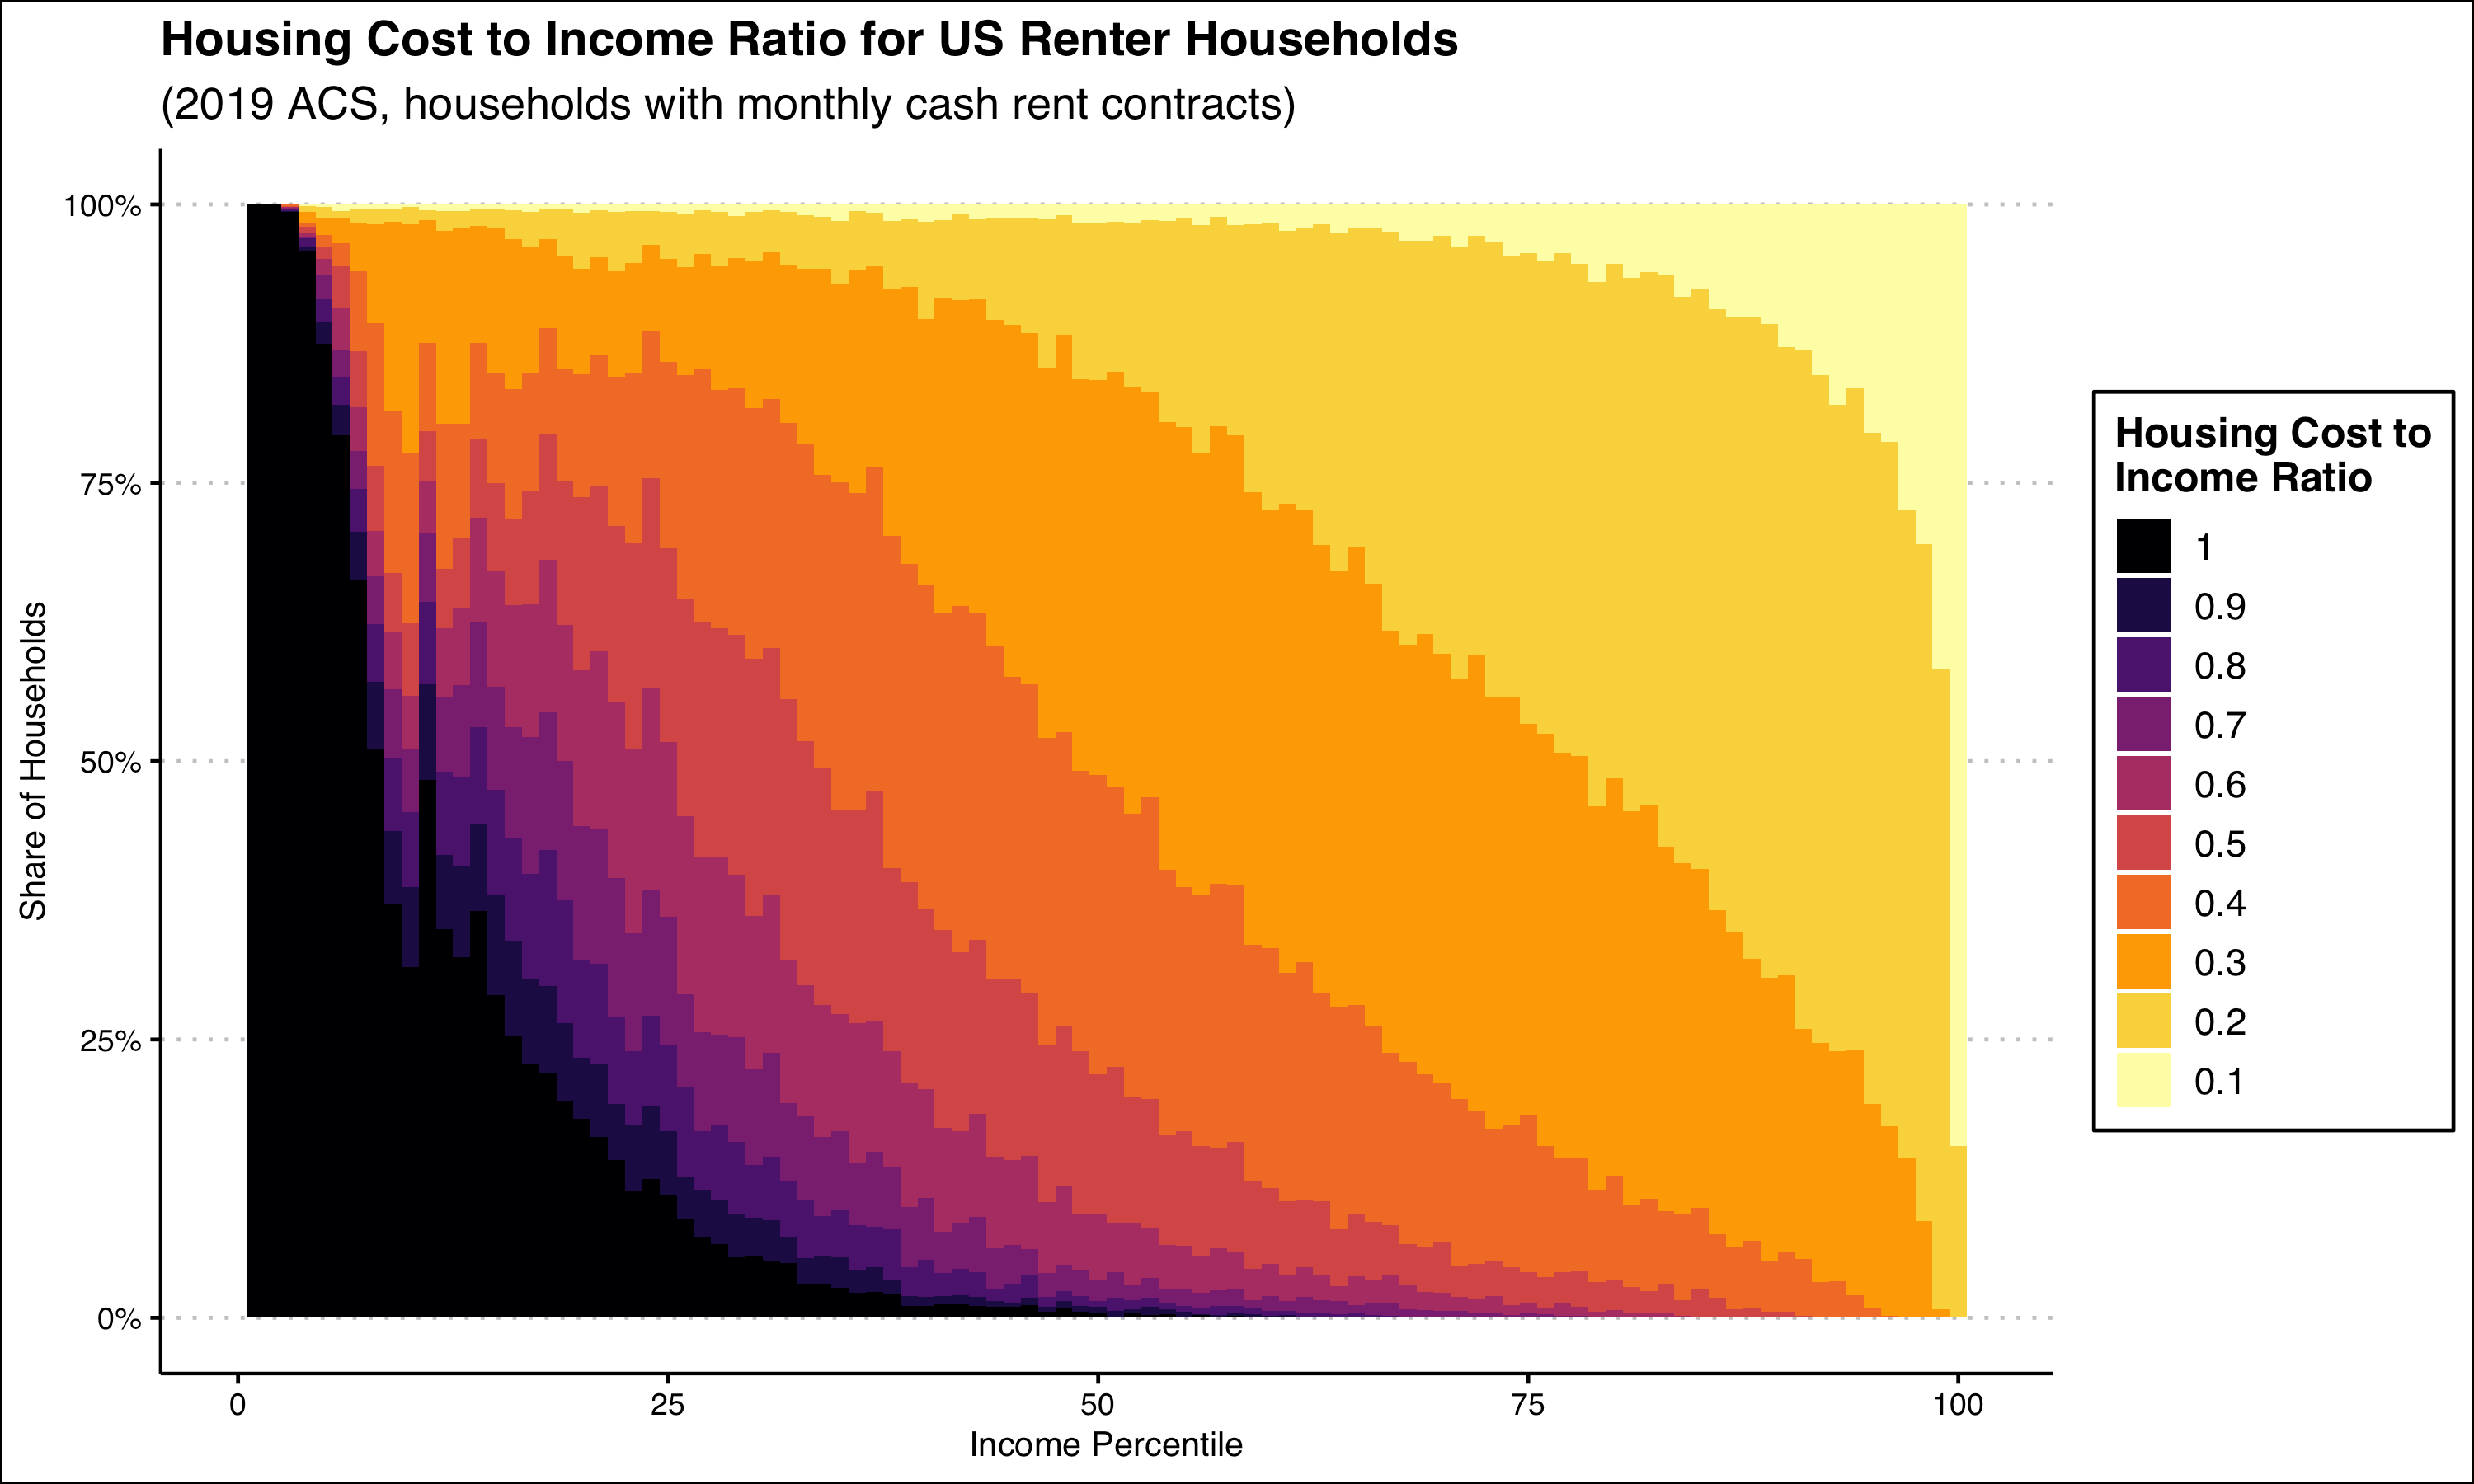
It may be difficult to pick out the differences between these approaches, so below I’ve produced a plot that shows a little more clearly what is going on.
In the case of the $500 monthly benefit, the share of renters in the cost burdened group keeps relatively steady, whereas severe cost burden group shrinks quite a bit. What’s going on behind the scenes is that many severely cost burdened households are moving down into the normal cost burden group, replacing some of the households who were cost burdened before but move down to the no burden group when they get the benefit. I made a Sankey diagram of this effect, but it actually looked kind of stupid so I’m not posting it.

The 25% rent reduction approach has a smaller impact, particularly for the severe cost burden group. For people at the very bottom of the income ladder, bringing rents down does very little to help with excessive monthly costs. These people in deep poverty simply need cash.
So should the government give everyone money?
This is a hyper-simplified model where I’ve just universally assigned $500 per month to every renter household in the US, with no benefit scaling whatsoever, which makes it basically a flat UBI for renters. As we can see from the charts above, while many households are clearly in a much better position with such a benefit, there is still a significant amount of cost burden overall.
A better designed benefit structure would bring the levels of cost burden down even lower. I’ll explore that in the next post in this topic. One takeaway should be clear, though: the problem of housing cost burden, as with most problems disproportionately impacting households in poverty, is primarily a lack of cash. With so many American renter households already in destitute poverty, ever-rising rents just compound the strain on household budgets.
This does not mean the ownership and production of housing does not need to be reorganized—it does. But even with solutions to these problems, there will continue to high levels of cost burden, particularly for the lowest income people. And just for starters, buildings take years to design and build. Even if we were to begin a massive new social housing production program tomorrow, it would take many, many years before enough housing was built to meet today’s need.
Short-term and mid-term, American renters need cash supports for housing costs. That more than one in ten renter households in this country is paying more than 90% of their income to their landlord every month is a travesty. But in the long term, perhaps we will see this issue fade away when the bizarre custom of private land ownership is finally addressed.

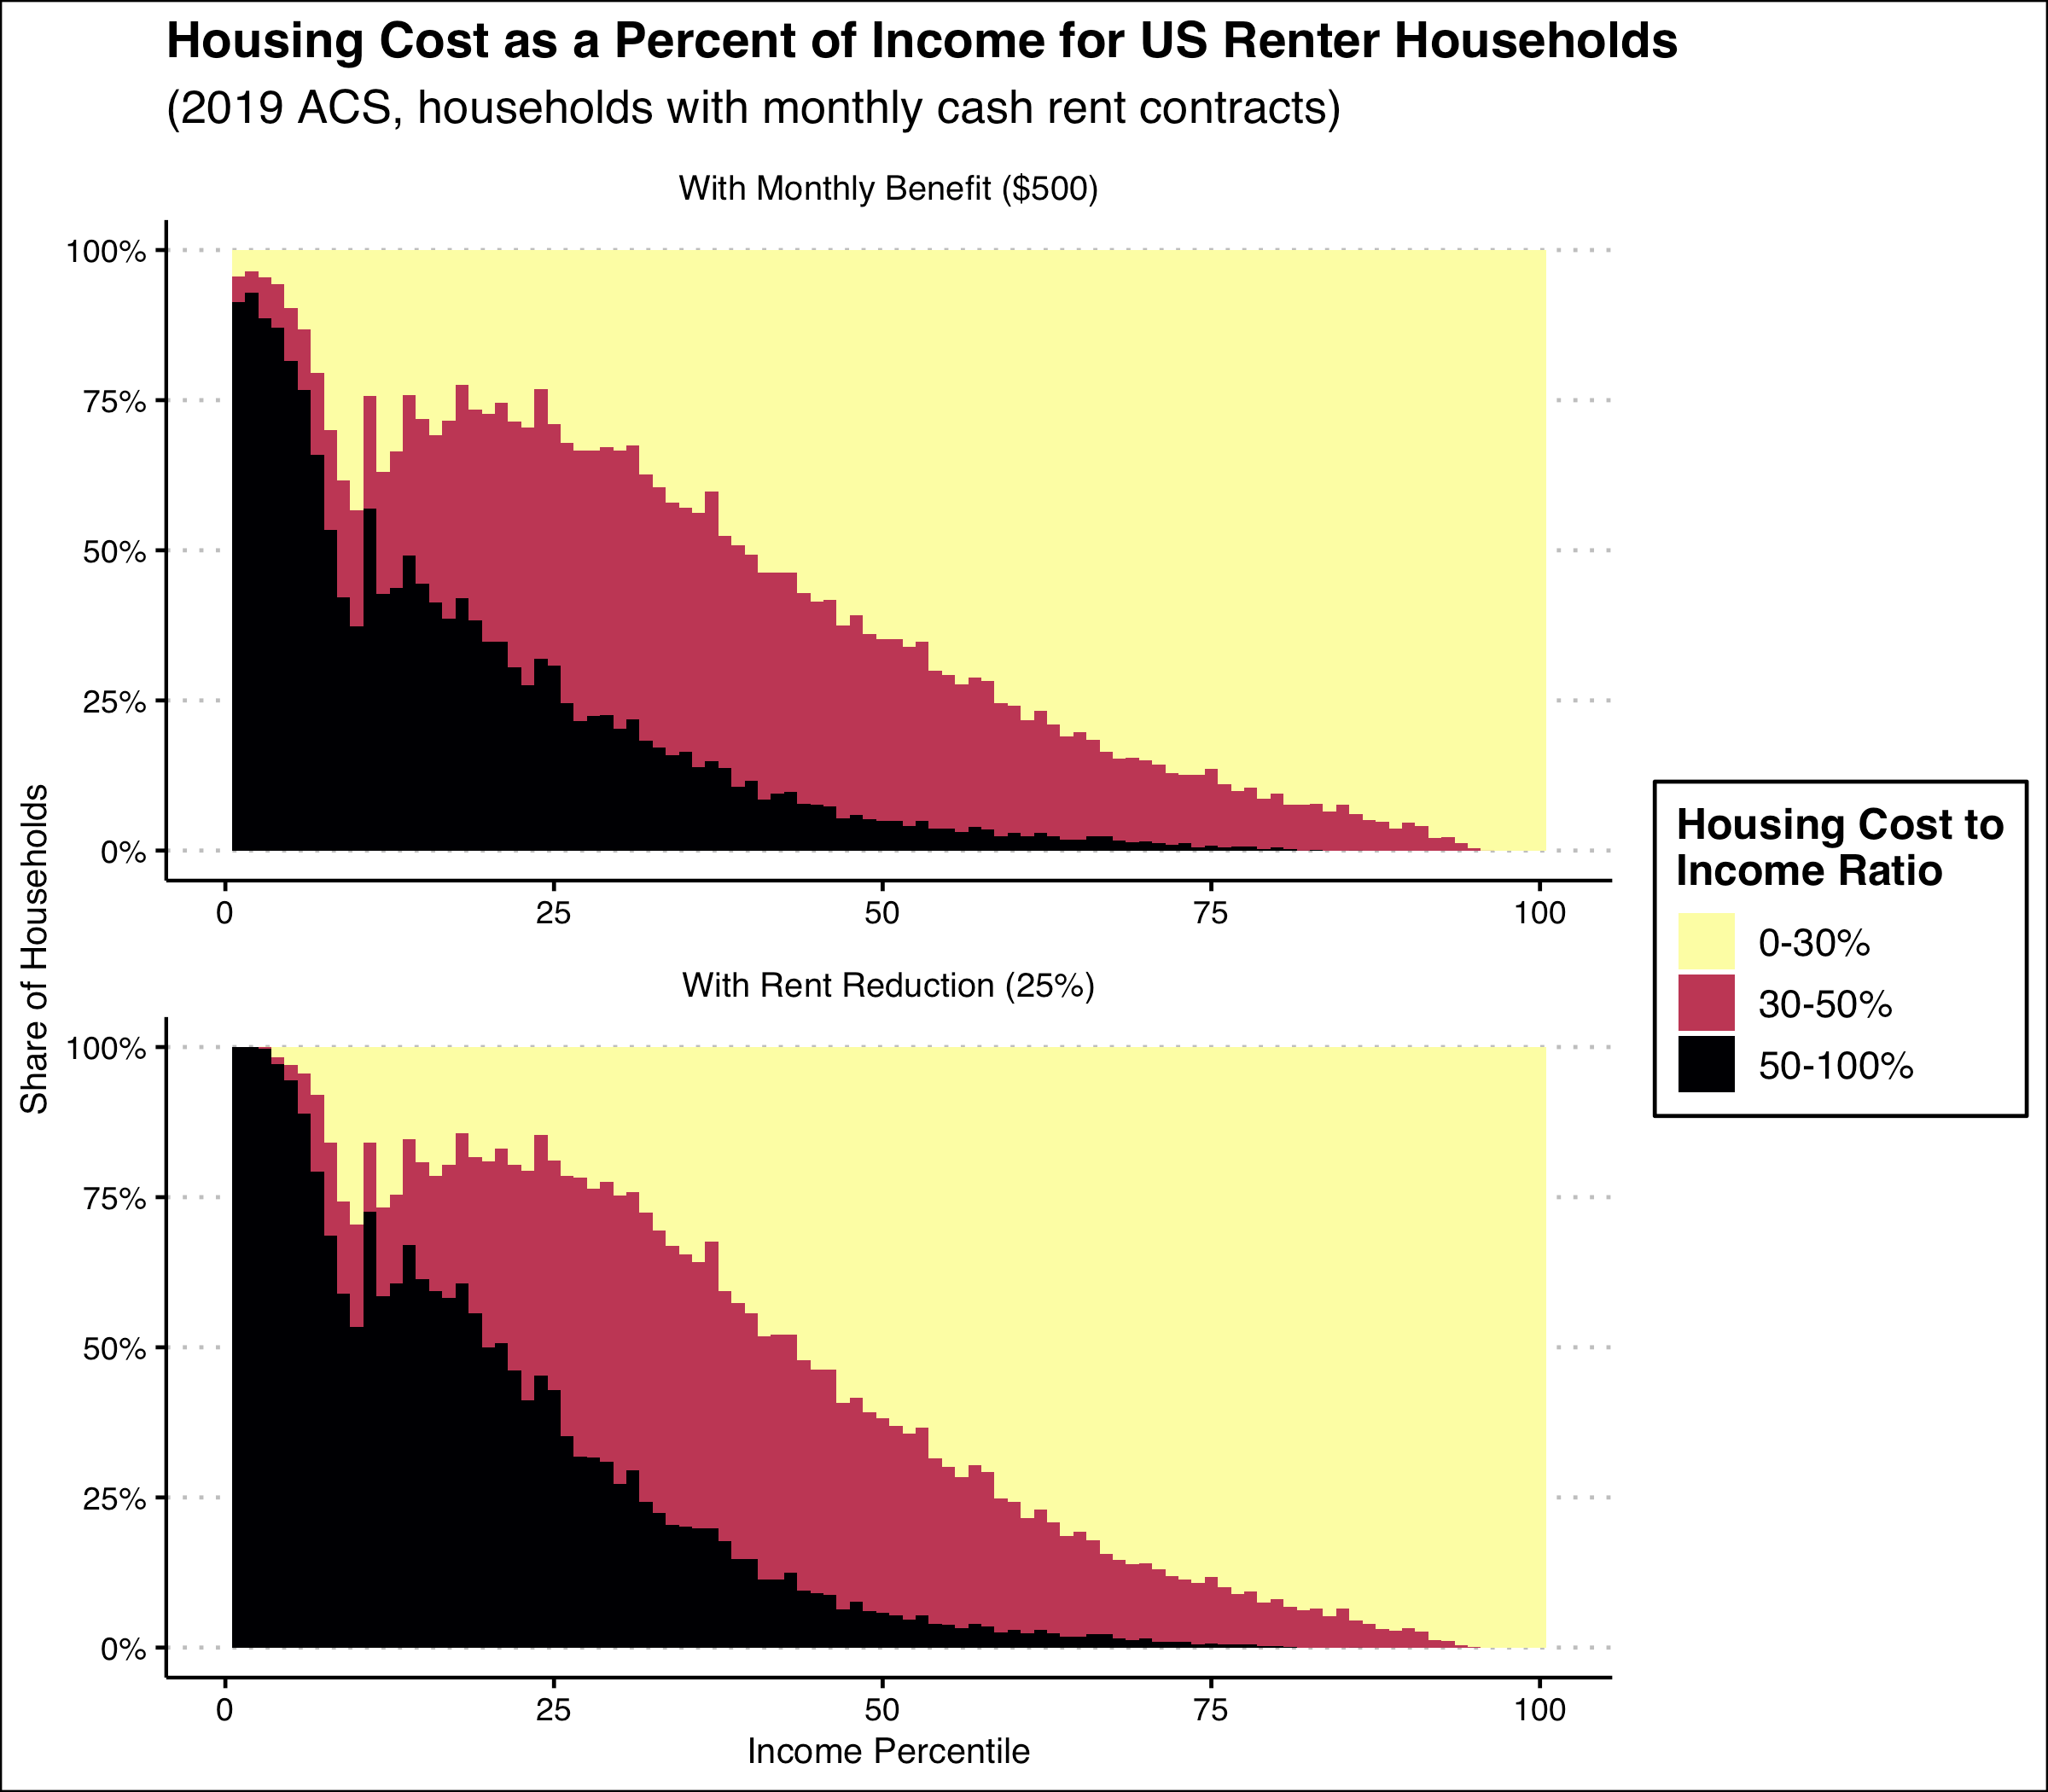
Appendix: Tables for Housing Cost to Income Ratios, from 2019 1-Year ACS